
Yutian volcano in Kunlun Volcanic Group. Image courtesy China Whisperer. http://www.chinawhisper.com/top-6-chinas-amazing-volcanoes/
The Kunlun Volcanic Group is a volcanic field in NW Tibet. It is the location of the most recent volcanic eruption in China, that of Ashi in 1951.
The field is also known as Ashikule, and is located in an extensional basin in far NW Tibet. This basin is the last remaining volcanic activity from the collision of India into Asia starting some 50 Ma with a soft collision of some portion of the continent and a hard collision some 25 Ma.
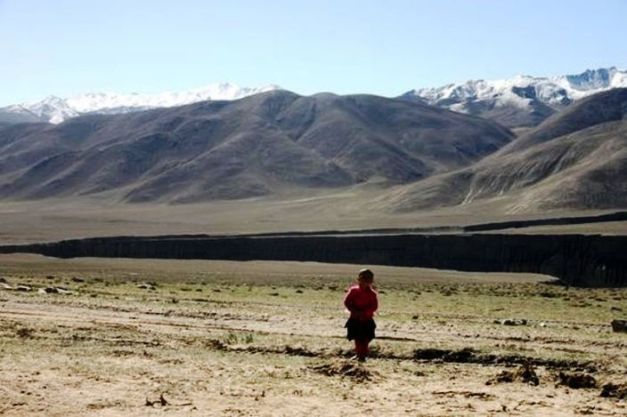
Local youngster in front of lava flow in the basin. Image courtesy http://wulkanyswiata.blogspot.de/2015/11/ashikule-kunlun-wyprawa-z-2011-roku-na.html
The area is extremely dry, remote and is one of the highest volcanic fields in the world, with the basin at an average altitude of 4,700 m.
The volcanic field erupts primarily trachyandesites and trachydacites, meaning the basaltic intraplate magmas are somewhat evolved. Eruptions built 70 pyroclastic cones, ten of them as recent as 5 – 0 Ma.
Over 22,000 live within 100 km of the volcanic field.
There three salt lakes in the area, one of which was formed when lava dammed a valley.
The Volcanic Seven Summits include the highest volcanoes on each of the seven continents. Like the Seven Summits, it is also a mountaineering challenge created in 1999. The Kunlun Volcanic Group by virtue of their base altitude reach 5,808 m at their highest point, is the highest active volcanic formation in the hemisphere and second highest volcano after Kilimanjaro. But by virtue of them being cinder, spatter and pyroclastic cones rather than volcanic mountains (stratovolcanoes), they are not counted as the highest in Asia. Mount Damavand at over 5,600 m holds that designation likely due to the low relief of the cinder cones.
Volcanoes
The Kunlun Volcanic Group is the last remaining volcanic expression of the collision of India into Asia. While there was some initial subduction with the collision, none of it is expressed today, as the crust is over 50 km thick underneath the volcanic group.
We have a complex series of faults, basins, and extensional forces working on region around the volcanic group. Magma makes its way to the surface through lines of weakness.

Ashishan Volcano in Kunlun Volcanic Group. Photo courtesy http://wulkanyswiata.blogspot.de/2015/11/ashikule-kunlun-wyprawa-z-2011-roku-na.html
Recent volcanism are distributed in two belts oriented generally E – W. The southern belt is controlled by the Kangxiwa fault. It has three volcanic districts – Kangziwa, Dahongliutan, and Quanshuigou. The northern belt has four volcanic districts names North Pulu, East Pulu, Ashikule and Adamupaixia. The southern belt was generally active 4 – 8 Ma. The northern belt has been active 3 Ma – present.
Lavas are generally intermediate – basic in chemical composition. Pyroclastics are rare. Lavas form bedded sheets or terraces with heights tens of meters. Lavas making up the terraces are generally thin (1 – 3m). There are perfectly preserved cinder cones.
Visually, these lavas look and act like basalts, though at least one paper listed below claims there are little to no basalts in the field. They are described as various trachyites in scientific papers describing this field. If so, they must have a very low gas content at the point of eruption, as they act like primitive magmas at the point of eruption.
North Pulu has two stages of volcanic activity. Other districts only had one. North Pulu also has some pyroclastic rocks. Lavas in North Pulu are layered with fluvial deposits 2 – 3 m thick. Lavas appear to be evolved within a shallow lava chamber.

Lava bombs from Kunlun volcanic activity. Photo courtesy http://wulkanyswiata.blogspot.de/2015/11/ashikule-kunlun-wyprawa-z-2011-roku-na.html
There are broad geochemical similarities between erupted lavas in the group with differences being explained by fractional crystallization of melts before eruption. Generally, the longer the time in the magma chambers, the larger difference between the magmas. The similarities suggest a common mantle source for the magmas. Crystallization depths are estimated at 7 – 9 km.
The Zhang et all paper concludes that the magma source is sub-continental lithospheric mantle rather than enriched asthenospheric mantle.
For the most part, volcanoes in this group are small, pyroclastic cones, spatter cones, and lava flows. There are 14 principal volcanoes in this field, with a total of 70 cones identified. There are cinder cones and silicic domes. The basin is covered by over 200 km2 of lava from the field.
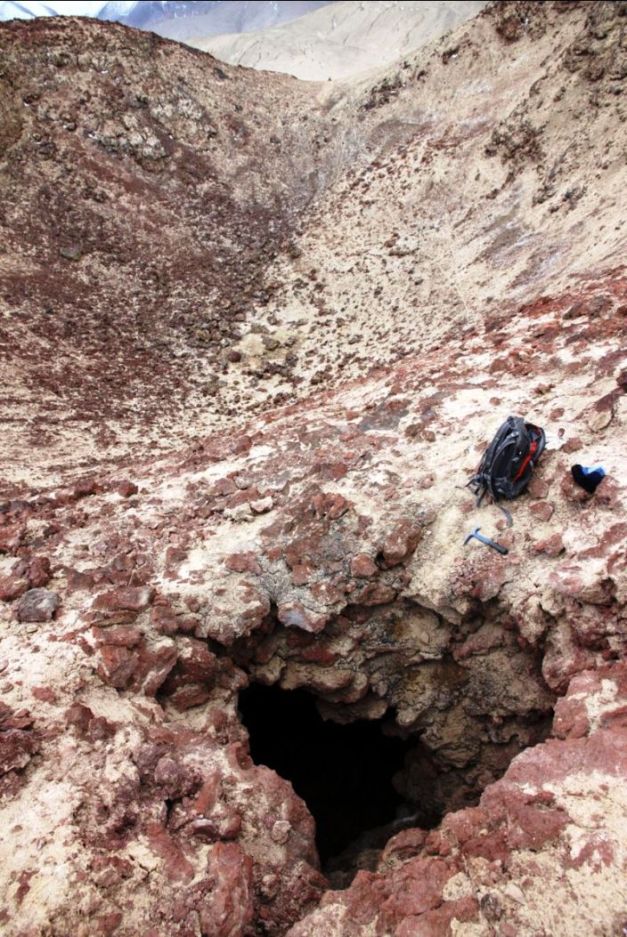
Active fumarole near Ashishan. Photo courtesy http://wulkanyswiata.blogspot.de/2015/11/ashikule-kunlun-wyprawa-z-2011-roku-na.html
Typical volcanoes measure perhaps half a kilometer in diameter with a height in the neighborhood of 100 m.
The most recent eruption came from Ashi. It has a 350 m diameter cone, 120 m high with a 50 m crater breached to the south. Lava flows from Ashi cover 33 km2.
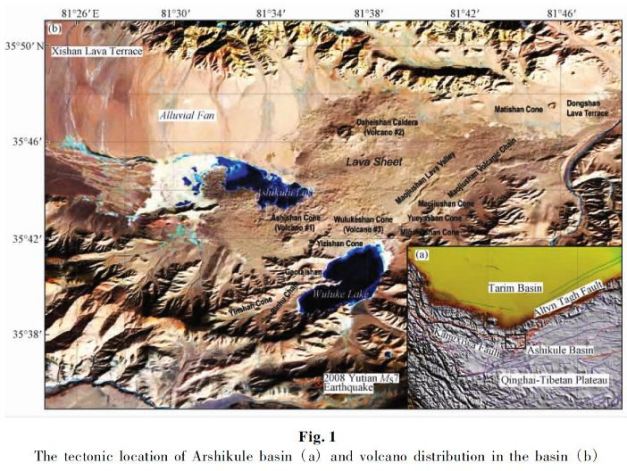
An M 7.2 earthquake took place in 2008 30 km south of the volcanic field, at the intersection of two major faults.
The Ashikule volcanic cluster is located on a graben region that is the convergence between two faults. It has 10 main volcanoes and dozens of smaller vents. It is the most recently active cluster of the field. Significant questions about deep location of the magma source, evolution process, and current state of the magma chamber remain open.
The Ashi (Ashishan or Volcano #1) volcano activity took three forms: explosive building of the cone, lava flows, and gas vents formed last. Its most recent eruption was explosive. The other volcanoes in the group measure 90 – 500 m in diameter. Activity building these cones were initially explosive followed by lava flows.

Location of Kunlun Volcanic Group in Tibet. Image courtesy USGS. https://worldvolcanoes.wikispaces.com/Eurasian+Plate+%2822%29
Volcanic activity created lava terraces. Lava flows are blocky and ropy. At least one of the cones has a horseshoe shape as lava flows carted off part of the cone. Two of the lava terraces have no recognizable sources. There are several volcanic chains, lines of small cones.
Oldest volcanic activity build weathered lava terraces and cone remnants. Intermediate activity built broken cones and moderately weathered lava flows. Most recent activity built well preserved cones and fresh lava flows.
Eruptions
The most recent eruption reportedly took place on May 27, 1951 from Ashi volcano. Troops building a road nearby reported roaring and saw a column of smoke which continued for several days. There was sufficient ash from the eruption to show up in ice cores.
On the other hand, the reality of the eruption has been debated for decades, as no solid evidence like lava flows were found. Dating recent activity in the Kunlun has the same difficulty as dating recent activity in the high Andes – dry, desert, high altitude tends to preserve eruptive products for a significant time. The region is also sparsely inhabited.
There is an unconfirmed report of an eruption in the 19th Century.
The field is currently dormant though there are fumaroles reported in the Ashi crater.

Unannotated satellite photo of Ashikule basin. Kunlun volcano is center left to the left of the lake. Image courtesy Smithsonian GVP. https://volcano.si.edu/volcano.cfm?vn=304030
Tectonics
The Tibetan plateau is the largest uplifted structure on Earth. It is constructed out of four main crustal blocks (terranes) delivered from the late Permian to the late Jurassic, long before the India – Asia collision. The plateau averages perhaps twice as thick as normal continental crust (70 – 80 km).
The India – Asia collision proceeded in two phases, with the soft phase starting 65 – 70 Ma. The hard collision started 45 Ma. Large scale volcanic activity was common 65 – 45 Ma.
There were a number of chunks of lithosphere delivered before the collision, arriving ahead of the approaching subcontinent. These chunks of lithosphere were squeezed out mainly to the east as the collision progressed, not unlike what we see in southcentral Alaska as the Pacific Plate delivers terranes to the underside of the North American Plate.
Around 20 Ma that mostly stopped and the impact piled up lithospheric materials under the plateau, which in turn thickened the crust and raised the eastern portion of the plateau. Massive earthquakes in the Himalayas appear to be connected to the ongoing uplift rather than strike slip motion along fault lines perpendicular to the motion of continuing impact.

Cross section of Tibet after collision. Image courtesy Pineterest. https://www.pinterest.com/pin/383087512030239431
There appeared to be significant volcanic activity in the region during the first portion of the impact. This activity tailed off over the eons.
Tibet is essentially four layered terranes (blocks), surrounded by the Indian, Yangtze and Tarim blocks (called plates in the source). While today it is basically being uplifted, it did undergo subduction with a volcanic suture zone and a magmatic island arc active during the first portions of the collision 45 – 50 Ma. Following that, compression started uplifting the Tibetan block. This formed the Qiantang volcanic belt along a rift zone.

Schematic geologic map of western Kunlun Mountains. Terranes constructing Tibet are depicted in upper right. Screen capture from Zhang, et all.
Starting perhaps 5 Ma, there was what one writer described as “catastrophic thinning” by delamination or other process of the thickened plateau which allowed hot asthenosphere mantle materials to create a crust – mantle mixed molten layer, the speculated source of most recent magmas. The region around Kunlun underwent substantial (described as violent in one paper) uplift which in turn led to additional decompression melts. Large scale active fracture zones are thought to control regional volcanic activity, allowing the newly created melts to the surface.
The reason for this delamination that the collision thickened the lithosphere too much to be stable (up to 200 km) and it rapidly detached.

Annotated satellite photo of Ashikule Basin. Screen capture from PressReader.com. https://www.pressreader.com/china/china-scenic/20170719/283051234502232
Post collisional volcanism is divided into four regions listed roughly from oldest to youngest – Qiangtang, 45 – 18 Ma, covering 6,100 km2. Hoh Xil, Gamgdese and middle Kunlun, 18 – 4 Ma, covers 3,100 km2. South Karakorum took place 8 – 25 Ma. Western Kunlun, 6 Ma to present covers 820 km2.
Volcanic activity appears to have been squeezed east and west from its beginning point 45 – 25 Ma. It became less vigorous as it migrated. Magmatic activity initially migrated northward from the initial suture. It then dispersed outwards from the plateau interior. Final activity was discrete migration to the plateau margins. Compositions of erupted magmas also changed over the last 45 Ma.
Extension in southern Tibet started 2 Ma, though there are evidence of minor stretching dating back as long as 18 Ma.
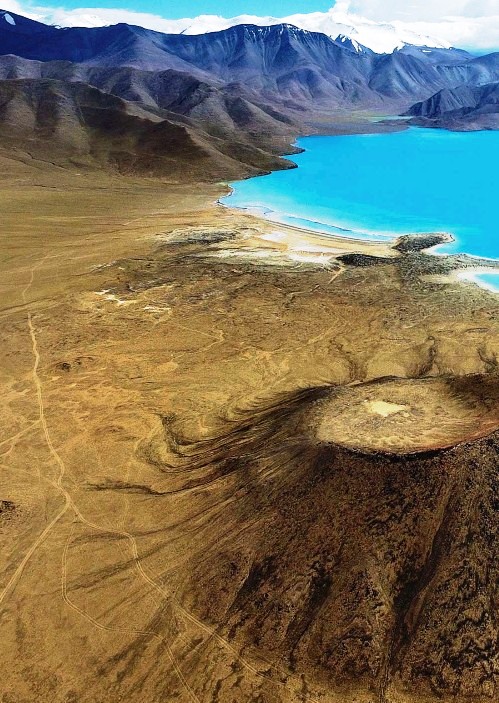
Ashi Volcano. Image courtesy PressReader.com. https://www.pressreader.com/china/china-scenic/20170719/283051234502232
Conclusions
While Kunlun appears to be the last remnants of volcanic activity associated with the collision of India into Asia, conditions still exist for future volcanic activity. There appears to be sufficient fluids available after delamination and decompression associated with the uplift of Tibet. And that uplift continues. There are a number of active fault lines separating terranes and other geologic discontinuities in the region that have in the past allowed magma from deep in the crust (> 50 km) to reach the surface. Whether or not that activity continues is anyone’s’ guess. The entire region remains highly earthquake prone. And as long as the collision continues, those earthquakes will continue.
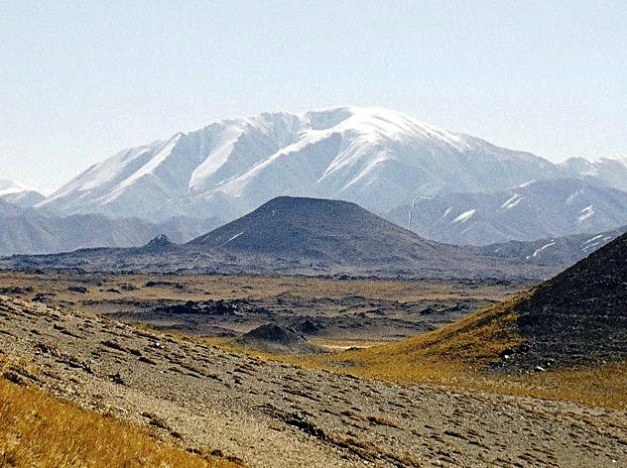
Kunlun Shan volcano. Image courtesy 7 Summits. http://7summitsclub.com/news/all/item_2115/
Additional information
https://en.wikipedia.org/wiki/Kunlun_Volcanic_Group
https://www.journals.uchicago.edu/doi/abs/10.1086/590135
http://onlinelibrary.wiley.com/doi/10.1029/2002TC001428/full
https://www.sciencedirect.com/science/article/pii/S0034425796001757
https://link.springer.com/article/10.1007/s11430-004-5317-8
http://onlinelibrary.wiley.com/doi/10.1111/j.1755-6724.2003.tb00567.x/full
https://www.journals.uchicago.edu/doi/abs/10.1086/449326
http://en.cnki.com.cn/Article_en/CJFDTOTAL-XJDI198301001.htm
http://rsta.royalsocietypublishing.org/content/327/1594/169.short
https://www.sciencedirect.com/science/article/pii/S1367912006002860
https://www.sciencedirect.com/science/article/pii/S0012821X0400072X
https://academic.oup.com/petrology/article/37/1/45/1530607
https://www.sciencedirect.com/science/article/pii/S1367912007001356
https://www.sciencedirect.com/science/article/pii/S0031920113001222
https://www.triposo.com/poi/T__b48c3d71c762
http://citeseerx.ist.psu.edu/viewdoc/download?doi=10.1.1.885.6264&rep=rep1&type=pdf
http://onlinelibrary.wiley.com/doi/10.1029/2002JB001877/pdf
http://www.cugb.edu.cn/upload/20600/papers_upload/news_201011309353.pdf
https://watermark.silverchair.com/37-1-45.pdf
http://erc.eq-j.cn/erc/ch/reader/create_pdf.aspx?file_no=20120201&year_id=2012&quarter_id=2&falg=1
https://www.pressreader.com/china/china-scenic/20170719/283051234502232



Hi
Here is an exploratory plot for Mayotte earthquake sequence (sorry a little late as I had some issues with Python).
You can see the quakes from May to November from the Catalog recently released by the BRGM (thanks guys and gals by the way !).
The color of the dots go from blue (older) to red (younger)
https://doi.org/10.18144/372c5809-3d30-440c-b44a-1c89385f176a
There seems to be 3 clusters and 2 different depths. Of course the precision is low as there is limited instrumentation on site for the time being.
I’ll redo something more elaborate later.
Thanks Agimarc for this new and unknown to me volcanic field ! Another discovery
LikeLike
Thanks a lot dfm, I thought you would come up with this as soon as you were ready 🙂
I wonder why they have no more different depths. The 20 km in July seem to be (halfways) real, since ESCM has some of those as well. Additionally, ESCM have quite a few of different depths, some at 2 km, 14-16 and 30 km. Well, perhaps those are also not very accurate. ESCM have also 5 new quakes in December, between M4 and M5, while the BRGM catalog is not being updated.
What I don’t quite understand is why it seems such a big problem to get several more seismic sensors installed very quickly. The thing has been going on for eight months now, and it seems to be an important case – for the residents of Mayotte as well as for French scientific research. It is not as if France is a poor country, they would have the means of putting a lot of new equipment where it is needed. But they still speak of limited instrumentation and being unable to determine smaller quakes. What do you think?
LikeLike
Ah, I just saw that BRGM posted a table of December quakes in their situation updates of 18/12 and one quake on 29/12. Still without depths, though, and only >M4 😦
And, they DO have the smaller EQs as well, they just don’t publish them:
“The last fortnight was very active and stronger than the previous fortnight with 99 earthquakes of magnitude greater than 3.5 averaging 5 per day. 8 earthquakes have a magnitude greater than 4.0, of which 1 detected by the USGS, but we also count 23 earthquakes with a magnitude slightly lower than this threshold (around 3.8-3.9).
[table of 8 EQs]
For the event of December 6, 2018, it is actually 2 equivalent earthquakes, 7-8 seconds apart. Low magnitude activity (<3.5) is important with several earthquakes per hour. 228 earthquakes were located over the period. If the localization becomes rather difficult because of the density and the mixture of the phases, it is always the zone towards 35-40 km of distance of Mamoudzou which is the most active.
Note the change in the typology of some earthquakes (low Frequency with S waves difficult to point and longer durations)."
LikeLike
Yes you are right on many points. I have also wondered why it took so long for the french scientists :
1 – to get there (no guys from france for several months)
2- to install some instrumentation (there is a raspishake added I think)
My analysis is :
– there was probably some guy responsible (geologically speaking) on the island. Getting there is not cheap and all the agencies have budget restrictions, even if France is not poor ( but did you see the yellow vests movement? All is not going well at the moment)
– Mayotte – it’s complicated- it is the youngest french department (only for a few years). It is also by far the poorest, even compared to the overseas (Réunion + West indies). The immigration from the Comores is a big problem (but an old story)
– the quakes have not posed too many problems at first, then some were felt by the population (some panic, some people sleeping outdoors) and that changed the authorities perspective.
– there was no immediate danger (and maybe the authorities did not want to draw attention on the quakes fearing stress in the population)
As for the catalog it is the FIRST time something has been made public. You have to know that the earthquake/volcano guys at first were from the CEA (Commissary to Atomic energy – like Tazieff) – probably linked to the nuclear test detection. They probably have kept some reflexive secrecy.
I’ll dig a bit around the USGS data, but their instruments are far away so precision is bad. French data gives only 2 standard depths 10 and 20km.
Cheers
LikeLike
Hi
Here is a new version of the visualization of the BRGM earthquake catalog data.
3D timelaspe of Mayotte earthquake sequence from May to November 2018.
Mayotte island is on the left.
First view is from the top, then from the east and finally a 360 rotation of all events
The first 2 parts are an event by event sequence, the latest event being a bigger red dot.
Event color changes according to its rank in the list with blue event being older and red events being younger.
Dot size is proportionnal to event magnitude.
The date and magnitude of the event is in the title bar
Bathymetry data from NOAA and SHOM Projet Homonim-http://dx.doi.org/10.17183MNT_MAY100m_HOMONIM_WGS84″
Sismo data from BRGM
Bertil D., Roullé A., Lemoine A.,Colombain A; Maisonhaute E., Dectot G. (2018) MAYEQSwarm2018:
BRGM earthquake catalogue for the Earthquake Swarm located East of Mayotte
May-November 2018. http://ressource.brgm.fr/data/data/372c5809-3d30-440c-b44a-1c89385f176a
Done with python 3.7 – Ubuntu 18.04
There are clearly 3 different clusters with 2 different depths. The latest cluster seems to get nearer the island.
LikeLike
Hi
I redid the plots with BRGM data (with a small pause at the end of each sequence) and I added the same plot but with USGS data (this goes up to January 2019).
On the USGS data plot you see that there are different depths than on the one using French BRGM data. However it is probably due to a lesser precision.
I have alos used some better bathymetric data from SHOM (french agency, bathymetry)
plot with BRGM Data
plot with USGS Data
Timelapse (event by event) of Mayotte earthquake activity since May 2108
Dot size is proportional to event magnitude.
Dot color is according to time, blue oldest and red youngest.
Current event displayed is a bigger red dot.
In the title bar you find the day of the event and the magnitude 3D view of Mayotte earthquakes’ location vs time First view is a top, second view is from the the south and finally there is a 360° rotation.
Mayotte island is on the left.
Topographic and bathymetric data from SHOM and NOAA Sismo data from USGS or BRGM.
Made with Python on Ubuntu 18.04
LikeLike